Results Study [POWER SHEETS]
So today is actually going to be a guest post by Andy C who is the data scientist and the brains behind the Power Sheets.

Main reason for this is that many are asking about the “results” that the sheet has been providing.
I want to take this opportunity again to emphasise that Power Sheets are a TOOL and NOT a tipping service.
However, I can understand that people want to know if the model prices and similar are producing profits since if we know that then we can all have much more confidence allowing the Power Sheets to guide us.
The only problem is how do we define the value we are looking for and what settings to use to generate these “results”?
Anyway, we ran a basic process on Excel and found that based on last season, backing EVERY outcome that displayed 10% value would have produced a 5% ROI.
This is GREAT as models like these are usually looking for around a 4-5% edge and is what the bookmakers and big syndicates would be extremely happy with. (Many suggest Star Lizard is doing 5% ROI for example)
So if a bookmaker can turn over 100 million during a season (easy to do over so many matches) then they can be confident they will make 5 million profit.
Anyway, the bad news is that we have to be honest and ask ourselves if any of us are going to realistically back EVERY single outcome that offers value? It is an insane amount of work, a huge commitment and unless we are planning to be bookmakers ourselves then it just won’t happen.
Realistically, we are going to have to cherry pick our bets and trades but this is not a bad thing.
Anyway, I wanted to run this so that those using the Power Sheets can have confidence in using it.
However…. (And here is the twist!)
Considering what we spoke about recently with finding inefficient prices in the market, I got talking with Andy and I said, what if you adjusted some settings in the sheets to only back outcomes with HIGH value margins? Might that increase the profits? What if we filtered only those that show historical profits etc? (He is probably sick of my constant questions and queries)
Anyway, I let him fiddle around with using the Power Sheet settings to see if we could increase that 5% ROI by being more selective and only betting on the very BEST value bets that it throws up.
And the results were interesting as Andy will explain in his guest post below. I literally only saw this a few days ago and I am excited about the potential of this.
Boil the kettle or grab a nice cold beer and have a read through this!
By the way, if you have no idea what the “Power Sheet” is then check out the latest Youtube video to see it in action.
P.S You can get this tool to keep starting on Christmas Eve, submit your email below to get the link to grab it!
Hi guys, Andy here.
Firstly, let’s take a look at the effectiveness of the Power model prices.
It is worth stating at the outset that some very big players in this industry spend huge sums of money on teams of mathematical brains to extract relatively small edges (3, 4 or 5%). This model is not meant to be some sort of alchemy process, however we believe that it can help the user to develop their own edge, whether looking to bet with value on the exchanges or more likely entering a trade at a price that is in their favour.
That said, in order to provide users with a guide, we built another spreadsheet which applied some rules to the options we provide in the Power Sheets. The study covers the 2019/20 and the current season for the leagues represented in the Elite Power Sheet.
Initially let’s set the “value edge” that we look for in the price to zero, so we are viewing all “value “ bets purely on the price. For this we are just using option 1 on the spreadsheet, set to 0%. (You can do this in your own sheets!)
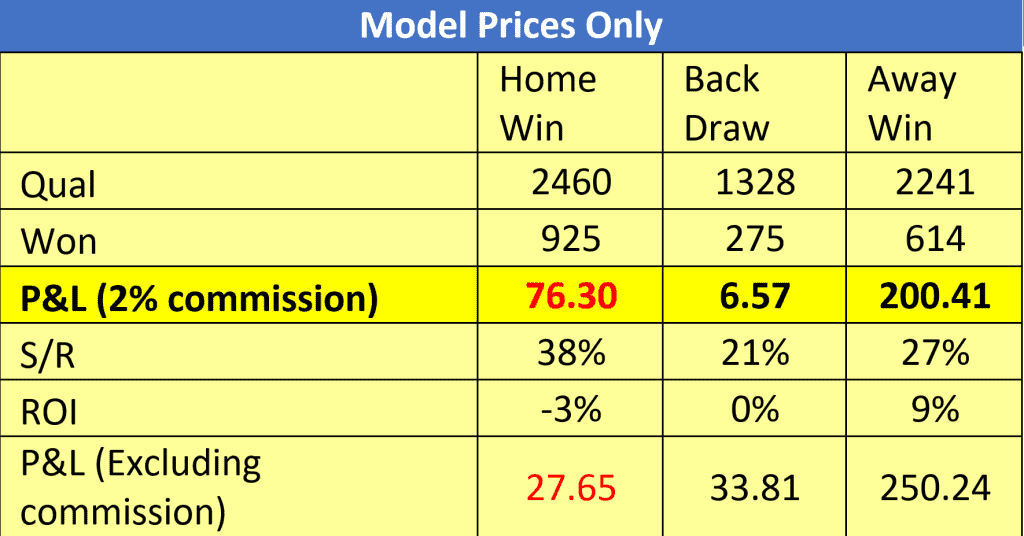
Before we look at returns as the “value %” is increased, just a quick word about how this percentage is calculated. We use the following sum:
Value % = (Digital starting price -1) / (model price -1)
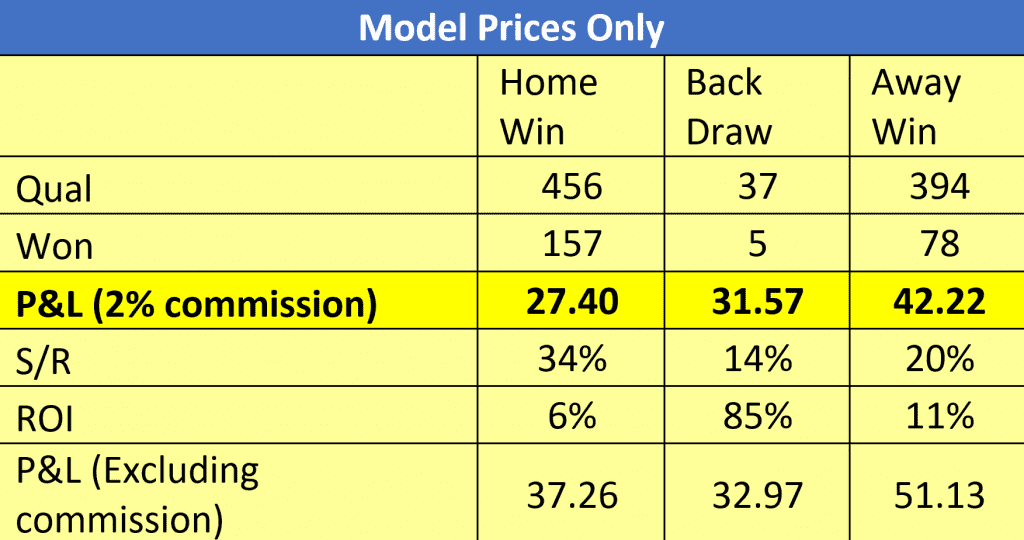
In the 18 months of results under analysis, the ROI for each market only really starts to move appreciably at a 40% value margin.

Note the slight drop off in strike rate due to increasing average prices due to the increased target margin.
Interestingly, many people’s initial logic when looking at a model such as this would be to discard potential bets where the market seems to be completely wrong.
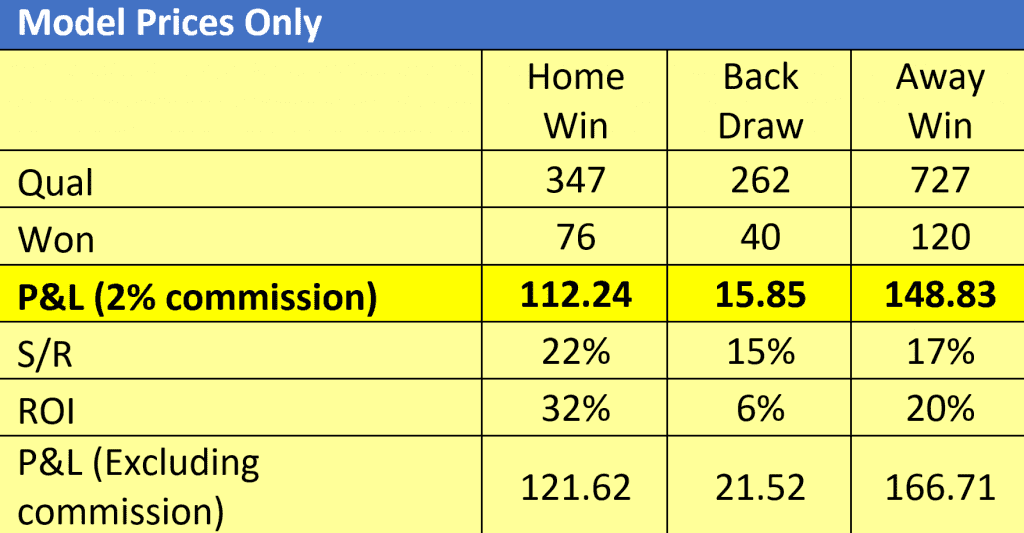
However, here is the table for our margin increased to a seemingly ludicrous 100%:
Whilst we wouldn’t be getting excited about the draw numbers here due to the small sample size, it is clear that there is a strong relationship between increasing the margin requested and the ROIs.
The other factor that you may want to consider here, is whether to work with a minimum price. As an example, introducing a minimum price of 4.0 improves our 40+% margin returns as follows:
Note the ROIs are increasing.
So lets leave that there for now and let’s call this micro system #1
Now let us consider the effectiveness of the previous ROI for games involving either team when priced at a similar level to the current game. There are endless possibilities here with the settings we have given you, but to simplify this basic study, we used a 25% price band and all games since 2012/13 as per the demonstration videos.
In practice you may want to play around with this and find your own angles. Maybe you would only look at Man City from 2016/17 when Pep Guardiola joined or Liverpool just in the Klopp era. For yo-yo teams you may just look at their most recent stay in the league, the choices are yours and depends on what YOU feel is most important.
As Ben explained in the Youtube videos, logic dictates that the best opportunities may occur where 2 or more of the historical ROI fields are green.
But let’s see if that is really true so to start with, let’s ignore the overall league returns and just concentrate on the historical returns for the two teams.
To start with we set the minimum ROI to create a “green” as 5%.
Why 5% you may ask?
In the development of our database, as with all such products, there has to be a margin for error in the closing prices used. However even at this level of complexity, we still believe that it is best to work with a tolerance of about 4%. In general when looking at returns, as the ROI grows towards double figures, the higher the confidence.
Hence we will start with a 5% minimum ROI.
Home team and away team both showing 5+% with a minimum of 5 games each to qualify (set league to -1000% to exclude that from the filter). Minimum price set to 4.0.
Combining this with the value conditions (40% over model price) we then get:

Adding in a league ROI of 5% makes little difference
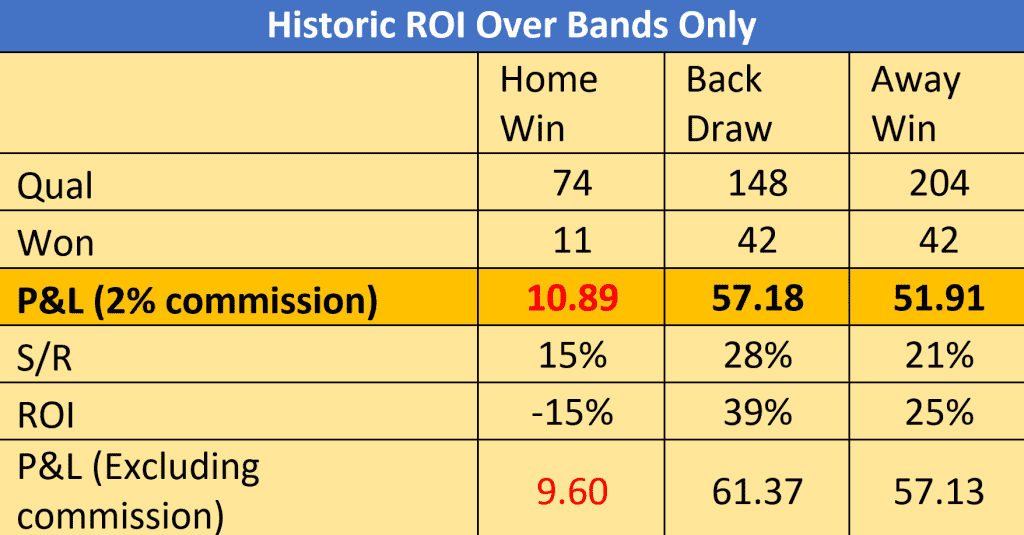
Next let’s look at another option Ben explored in the videos where we look for 2 or 3 “greens”. To start with we will ignore the model prices. To run this, we set the home team, away team and league ROI requirements to 5% and the number of greens to 2 using the drop down menu. Minimum price set at 4 still.
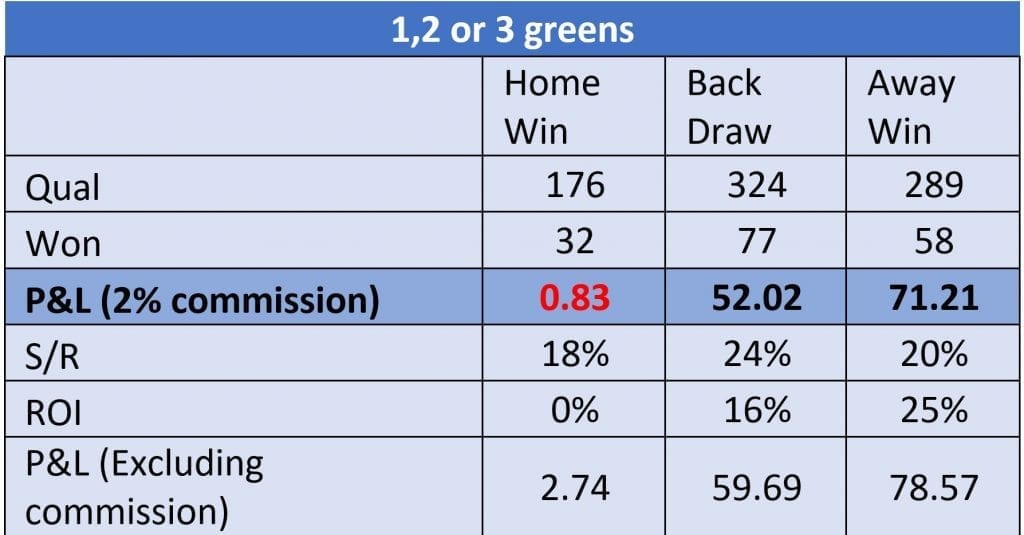
The ROI on Home Wins is negative but the ROI on Draw and Away win is VERY significant. So let’s call this Micro System 2.
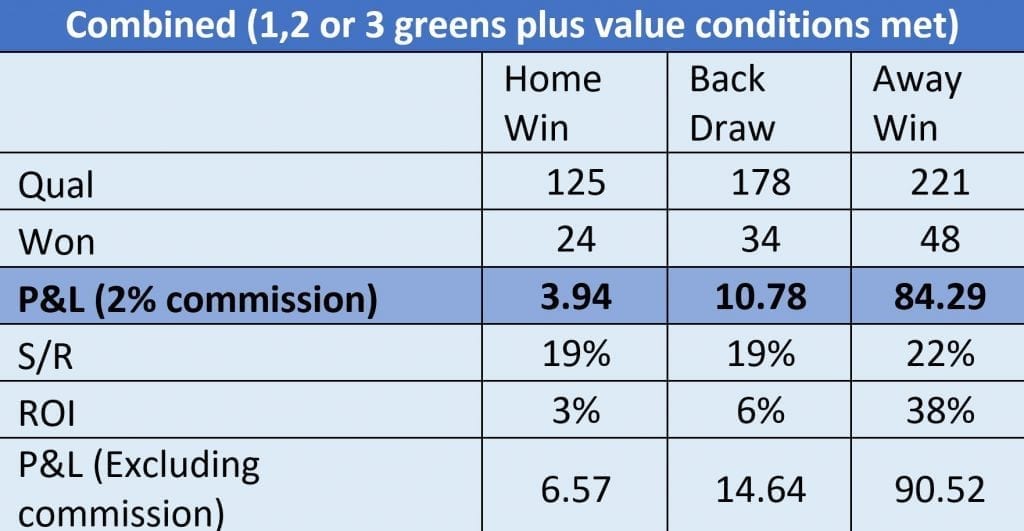
When combined with our model price requirement as well, we get

Setting the value % for the model to 0, we get
As you can see, there are hours of fun to had playing around with this!! (This spreadsheet is available as a BONUS in the Power Sheets members area)
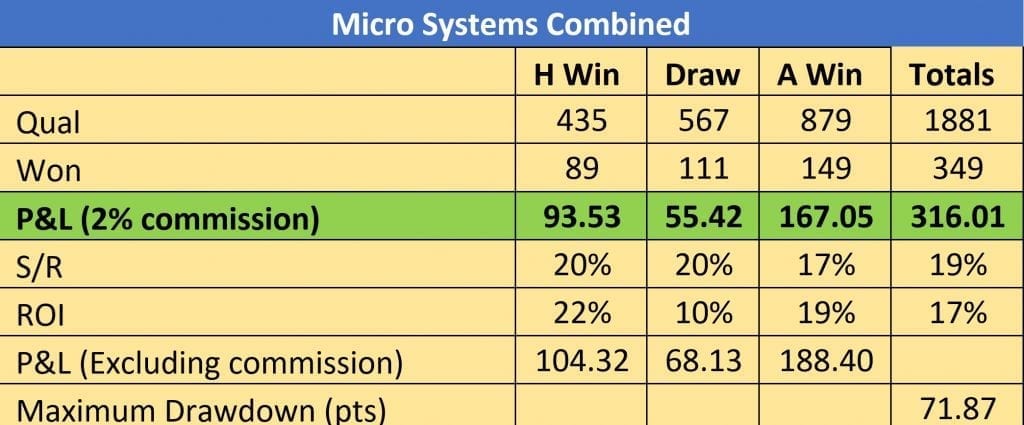
For the sake of creating our demonstration system we will use a combination of any game which meets micro system 1 and any game meeting micro system 2. To recap the rules are:
System 1. Back any home, draw or away win outcome where the model shows a 40%+ margin and the odds are 4.0 or greater
System 2. Back any home, draw or away win outcome where at least two of the 3 ROI’s (Home team, away team, overall league) show at least 5% ROI and the odds are 4.0 or greater.
Any outcome meeting either of the above criteria qualifies as a bet
Next we have broken this down by league:
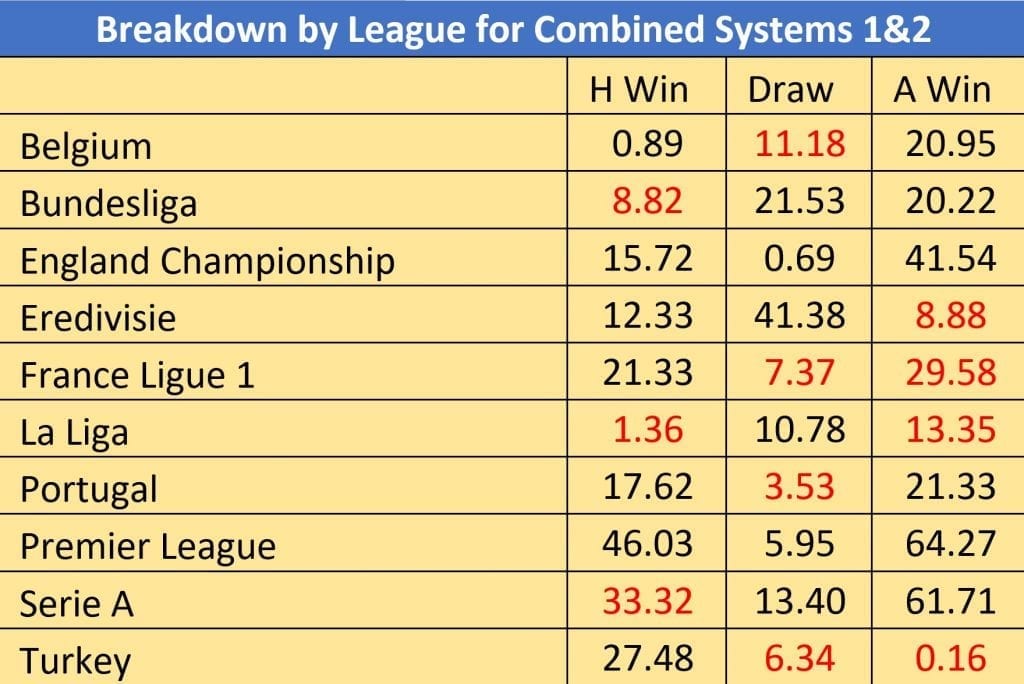
As expected there are significant variances between leagues and given the number of qualifiers, sample sizes are probably too small to make clear decisions regarding which leagues to include or exclude.
Early indications show that avoiding backing home wins in Serie A, and avoiding away wins in France 1 could make this even more profitable. Either way, we are working on another tool which will help with that!
Finally, we plotted a P&L chart to show how the profits accrued over the 18 months under review (around half way through is when COVID struck):
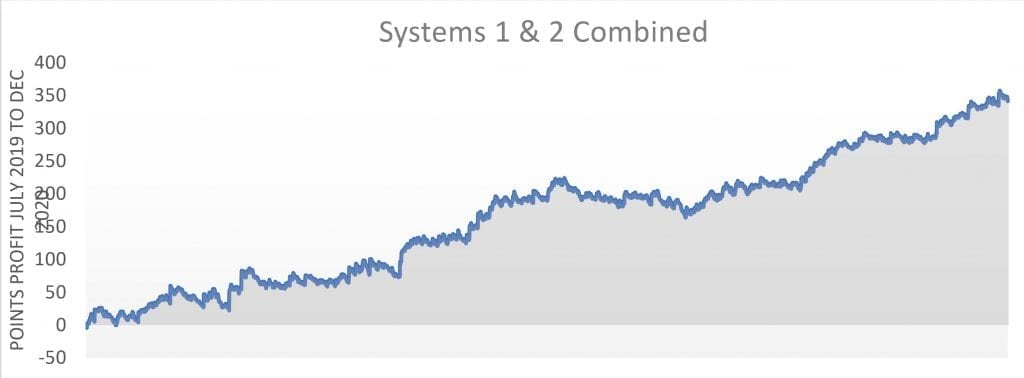
IMPORTANT: You will also notice that we have included a maximum drawdown figure as well to give some guidance for staking in relation to your betting bank.
As a guide you may want to double whatever the result is to give some indication of a sensible staking level.
In our example here, the deepest drawdown is -71.87 points, so maybe 140 points would be a sensible way to set out. If starting with say £1000, your stake would be £7.
We have also included a drawdown graph so that you can see how frequently various level of drawdown occur. When value betting this can help as a guide to the levels of variance your systems should expect.
In the below example, many punters will have probably given up if they started betting in the middle of this as the last drawdown took a long time to resolve!
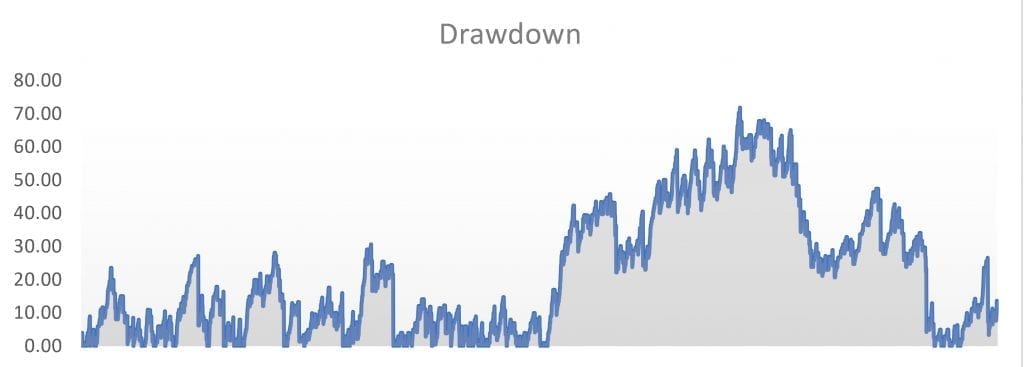
This illustrates that it might be profitable in the end but it would be a rollercoaster of a system to follow.
Anyway, this is not intended to be a proven long term system guaranteed to turn profits (and we definitely don’t want you to jump on this blindly), but it does serve to illustrate the potential of the Power Sheets.
Users are advised to explore the many possibilities and find what works for them!!! If you are trading rather than value betting, getting strong entry points for your trades is a solid step on the route to profits as well.
Good luck!
Andy
The Power Sheets Database will be available to buy on Thursday 24th December for a limited time only.
We will NOW also be including a special bonus which will be the above spreadsheet tool Andy used to find the most profitable Power Sheets settings. You can play around with it and find which settings work best for you and your own comfort level.
We will also give you the full results dossier so you can see EVERY bet that would have been placed in the above “Micro Systems” strategy.
It is important to keep in mind the main point of this article was not to suggest using the Power Sheets as a tipping service but to show you the potential they have and that you can use it with CONFIDENCE going forwards.
Get on the waiting list below to be the one of the first to own and play around with this!


-----------------------------------------------------------------------
Want to see HOW we make Correct Score Trading Profits Like This?

Check out our FREE Correct Score Trading ebook while it is still availableand get it all explained.
Price: FREE
Just tell us where to email it to...
CLICK HERE TO DOWNLOAD NOW!-----------------------------------------------------------------------


This is truly a remarkable Post! Congratualations and thank you both for all the hard work you have put into this project.
From Ben’s videos, I would assume each match and current odds must be input to the Power Sheet one-by-one. To do that with all the leagues in the final table above would take quite a long time. Would the Power Sheet allow me to VBA an algorithm of my own to run a batch file (Team & Draw odds compiled by my own research), and so to complete a whole league’s match inputs at the click of a button? It would be very, very helpful to those of us who work 9-5.
Hi Stuart!
I saw your email also and I replied to that, I am still waiting to find out about this, will email you as soon as I know!